


Acumatica のデータをDevExpress Data Grid にデータバインドする。

Acumatica 用の CData ADO.NET プロバイダーはサードパーティーコントロールで使うことのできる通常のADO.NET データベースアクセスコンポーネントを実装しています。データバインドするための通常のADO.NET プロセスに従うことで、UI コントロールから実データへの双方向アクセスを可能にします。 この記事では、CData を使ってDevExpress Windows Forms とウェブコントロールにデータバインドする方法を説明します。ここでは、最新のデータを表示するチャートにデータバインドします。
Acumatica 接続プロパティの取得・設定方法
Acumatica への接続
Acumatica データソースに接続するには、次の接続プロパティを指定する必要があります。
- URL:(必須)Acumatica ERP インスタンスのベースURL。例:https://domain.acumatica.com/。
- Schema:(オプション)異なるデータを含む2つのスキーマがあります。デフォルトはREST で、Acumatica REST コントラクトベースのAPI を使用し、OData スキーマはAcumatica OData API を使用します。OData スキーマはAcumatica Generic Inquiries へのクエリに使用されます。
- Company:(一部必須)会社名またはテナント名に設定。Schema がOData に設定されている場合は必須です。
- EndpointVersion:(オプション)Web Services エンドポイントのバージョン。例:24.200.001。これはREST スキーマにのみ適用されます。
- EndpointName:(オプション)Web Services エンドポイントの名前。例:Default。これはREST スキーマにのみ適用されます。
Acumatica への認証
Acumatica データソースへの接続に使用できる認証方法は2つあります。Basic およびOAuth です。 Basic 認証では、AuthScheme をBasic に設定し、User とPassword をログイン資格情報に設定します。 OAuth 認証については、ヘルプドキュメントの「接続の確立」セクションにある「OAuth」を参照してください。
Windows Forms コントロール
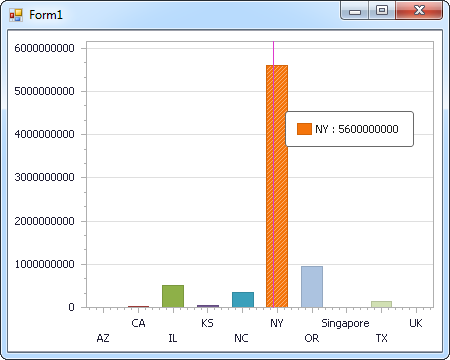
下のコードでは、Acumatica でDevExpress のチャートに追加する方法を説明します。AcumaticaDataAdapter はチャートコントロールのSeries プロパティにバインドします。コントロールのDiagram プロパティはx 軸とy 軸をカラム名として定義します。
using (AcumaticaConnection connection = new AcumaticaConnection(
"Url = https://try.acumatica.com/ISV/;EndpointName=Default;EndpointVersion=24.200.001;User=user;Password=password;Company=CompanyName;")) {
  AcumaticaDataAdapter dataAdapter = new AcumaticaDataAdapter(
  "SELECT Id, location_displayname FROM Events", connection);

  DataTable table = new DataTable();
  dataAdapter.Fill(table);
  DevExpress.XtraCharts.Series series = new DevExpress.XtraCharts.Series();
  chartControl1.Series.Add(series);
  DataTable table = new DataTable();
  series.ValueDataMembers.AddRange(new string[] { "location_displayname" });
  series.ArgumentScaleType = DevExpress.XtraCharts.ScaleType.Qualitative;
  series.ArgumentDataMember = "Id";
  series.ValueScaleType = DevExpress.XtraCharts.ScaleType.Numerical;
  chartControl1.Legend.Visibility = DevExpress.Utils.DefaultBoolean.False;
  ((DevExpress.XtraCharts.SideBySideBarSeriesView)series.View).ColorEach = true;
}
Web コントロール
下のコードではAcumatica でDevExpress Web を操作するための設定方法を説明します。AcumaticaDataAdapter はチャートのSeries プロパティにバインドします。Diagram プロパティはx 軸とy 軸をカラム名として定義します。
using DevExpress.XtraCharts;

using (AcumaticaConnection connection = new AcumaticaConnection(
"Url = https://try.acumatica.com/ISV/;EndpointName=Default;EndpointVersion=24.200.001;User=user;Password=password;Company=CompanyName;"))
{
  AcumaticaDataAdapter AcumaticaDataAdapter1 = new AcumaticaDataAdapter("SELECT Id, location_displayname FROM Events", connection);
  DataTable table = new DataTable();
  AcumaticaDataAdapter1.Fill(table);
  DevExpress.XtraCharts.Series series = new Series("Series1", ViewType.Bar);
  WebChartControl1.Series.Add(series);
  DataTable table = new DataTable();
  series.ValueDataMembers.AddRange(new string[] { "location_displayname" });
  series.ArgumentScaleType = ScaleType.Qualitative;
  series.ArgumentDataMember = "Id";
  series.ValueScaleType = ScaleType.Numerical;
  ((DevExpress.XtraCharts.SideBySideBarSeriesView)series.View).ColorEach = true;
}

はじめる準備はできましたか?
Acumatica Data Provider の無料トライアルをダウンロードしてお試しください:
ダウンロード詳細:
Acumatica のAccounts、Bills、Customers、Leads などの会計データに連携する.NET アプリケーションを素早く、簡単に開発できる便利なドライバー。